INTERNATIONAL COUNCIL FOR HARMONISATION OF TECHNICAL REQUIREMENTS FOR PHARMACEUTICALS FOR HUMAN USE
ICH HARMONISED GUIDELINE
BIOANALYTICAL METHOD VALIDATION AND STUDY SAMPLE ANALYSIS
M10
Final version Adopted on 24 May 2022
This Guideline has been developed by the appropriate ICH Expert Working Group and has been subject to consultation by the regulatory parties, in accordance with the ICH Process. At Step 4 of the Process the final draft is recommended for adoption to the regulatory bodies of ICH regions.
M10
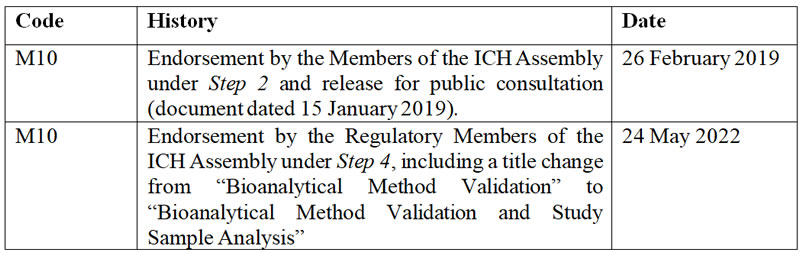
Document History
Legal notice: This document is protected by copyright and may, with the exception of the ICH logo, be used, reproduced, incorporated into other works, adapted, modified, translated or distributed under a public license provided that ICH's copyright in the document is acknowledged at all times. In case of any adaption, modification or translation of the document, reasonable steps must be taken to clearly label, demarcate or otherwise identify that changes were made to or based on the original document. Any impression that the adaption, modification or translation of the original document is endorsed or sponsored by the ICH must be avoided.
The document is provided "as is" without warranty of any kind. In no event shall the ICH or the authors of the original document be liable for any claim, damages or other liability arising from the use of the document.
The above-mentioned permissions do not apply to content supplied by third parties. Therefore, for documents where the copyright vests in a third party, permission for reproduction must be obtained from this copyright holder.
ICH HARMONISED GUIDELINE
BIOANALYTICAL METHOD VALIDATION AND STUDY SAMPLE ANALYSIS
M10
ICH Consensus Guideline
TABLE OF CONTENTS
1. INTRODUCTION 6
1.1 Objective 6
1.2 Background 6
1.3 Scope 6
2. GENERAL PRINCIPLES 7
2.1 Method Development 7
2.2 Method Validation 8
2.2.1 Full Validation 8
2.2.2 Partial Validation 9
2.2.3 Cross Validation 9
3. CHROMATOGRAPHY 9
3.1 Reference Standards 9
3.2 Validation 10
3.2.1 Selectivity 10
3.2.2 Specificity 11
3.2.3 Matrix Effect 11
3.2.4 Calibration Curve and Range 12
3.2.5 Accuracy and Precision 13
3.2.5.1 Preparation of Quality Control Samples 13
3.2.5.2 Evaluation of Accuracy and Precision 14
3.2.6 Carry-over 14
3.2.7 Dilution Integrity 15
3.2.8 Stability 15
3.2.9 Reinjection Reproducibility 18
3.3 Study Sample Analysis 18
3.3.1 Analytical Run 19
3.3.2 Acceptance Criteria for an Analytical Run 19
3.3.3 Calibration Range 21
3.3.4 Reanalysis of Study Samples 21
3.3.5 Reinjection of Study Samples 23
3.3.6 Integration of Chromatograms 23
4. LIGAND BINDING ASSAYS 23
4.1 Key Reagents 23
4.1.1 Reference Standard 23
4.1.2 Critical Reagents 23
4.2 Validation 24
4.2.1 Specificity 25
4.2.2 Selectivity 25
4.2.3 Calibration Curve and Range 26
4.2.4 Accuracy and Precision 27
4.2.4.1 Preparation of Quality Control Samples 27
4.2.4.2 Evaluation of Accuracy and Precision 27
4.2.5 Carry-over 28
4.2.6 Dilution Linearity and Hook Effect 28
4.2.7 Stability 29
4.3 Study Sample Analysis 30
4.3.1 Analytical Run 30
4.3.2 Acceptance Criteria for an Analytical Run 31
4.3.3 Calibration Range 32
4.3.4 Reanalysis of Study Samples 32
5. INCURRED SAMPLE REANALYSIS (ISR) 33
6. PARTIAL AND CROSS VALIDATION 35
6.1 Partial Validation 35
6.2 Cross Validation 36
7. ADDITIONAL CONSIDERATIONS 37
7.1 Methods for Analytes that are also Endogenous Molecules 37
7.1.1 Quality Control Samples for Methods for Analytes that are also Endogenous Molecules 39
7.1.2 Selectivity, Recovery and Matrix Effects for Methods for Analytes that are also
Endogenous Molecules 39
7.1.3 Parallelism for Methods for Analytes that are also Endogenous Molecules 40
7.1.4 Accuracy and Precision for Methods for Analytes that are also Endogenous Molecules 40
7.1.5 Stability for Methods for Analytes that are also Endogenous Molecules 41
7.2 Parallelism 41
7.3 Recovery 42
7.4 Minimum Required Dilution 42
7.5 Commercial and Diagnostic Kits 42
7.6 New or Alternative Technologies 43
7.6.1 Dried Matrix Methods 44
8. DOCUMENTATION 44
8.1 Summary Information 45
8.2 Documentation for Validation and Bioanalytical Reports 45
9. GLOSSARY 53
1. INTRODUCTION
1.1 Objective
This guideline is intended to provide recommendations for the validation of bioanalytical methods for chemical and biological drug quantification and their application in the analysis of study samples. Adherence to the principles presented in this guideline will ensure the quality and consistency of the bioanalytical data in support of the development and market approval of both chemical and biological drugs.
The objective of the validation of a bioanalytical method is to demonstrate that it is suitable for its intended purpose. Changes from the recommendations in this guideline may be acceptable if appropriate scientific justification is provided. Applicants are encouraged to consult the regulatory authority(ies) regarding significant changes in method validation approaches when an alternate approach is proposed or taken.
1.2 Background
Concentration measurements of chemical and biological drug(s) and their metabolite(s) in biological matrices are an important aspect of drug development. The results of studies employing such methods contribute to regulatory decisions regarding the safety and efficacy of drug products. It is therefore critical that the bioanalytical methods used are well characterised, appropriately validated and documented in order to ensure reliable data to support regulatory decisions.
This guideline intends to facilitate development of drugs in accordance with the principles of 3Rs (Reduce, Refine, Replace) for animal studies, where valid.
1.3 Scope
This guideline describes the validation of bioanalytical methods and study sample analysis that are expected to support regulatory decisions. The guideline is applicable to the bioanalytical methods used to measure concentrations of chemical and biological drug(s) and their metabolite(s) in biological samples (e.g., blood, plasma, serum, other body fluids or tissues) obtained in nonclinical toxicokinetic (TK) studies conducted according to the principles of GLP, nonclinical pharmacokinetic (PK) studies conducted as surrogates for clinical studies, and all phases of clinical trials, including comparative bioavailability/bioequivalence (BA/BE) studies, in regulatory submissions. Full method validation is expected for the primary matrix intended to support regulatory submissions. Additional matrices should be validated as necessary.
For studies that are not submitted for regulatory approval or not considered for regulatory decisions regarding safety, efficacy or labelling (e.g., exploratory investigations), applicants may decide on the level of qualification that supports their own internal decision making.
The information in this guideline applies to the quantitative analysis by ligand binding assays (LBAs) and chromatographic methods such as liquid chromatography (LC) or gas chromatography (GC), which are typically used in combination with mass spectrometry (MS) detection.
For studies that are subject to Good Laboratory Practice (GLP) or Good Clinical Practice (GCP) the bioanalysis of study samples should also conform to their requirements.
The bioanalysis of biomarkers and bioanalytical methods used for the assessment of immunogenicity are not within the scope of this guideline.
2. GENERAL PRINCIPLES
2.1 Method Development
The purpose of bioanalytical method development is to define the design, operating conditions, limitations and suitability of the method for its intended purpose and to ensure that the method is ready for validation.
Before or during the development of a bioanalytical method, the applicant is encouraged to, if feasible, understand the analyte of interest (e.g., the physicochemical properties of the drug, in vitro and in vivo metabolism, preferential distribution between red blood cells and plasma, and protein binding) and consider aspects of any prior analytical methods that may be applicable.
Method development involves identifying the procedures and conditions involved with quantifying the analyte. Method development can include the characterisation of the following bioanalytical elements: reference standards, critical reagents, calibration curve, quality control samples (QCs), selectivity and specificity, sensitivity, accuracy, precision, recovery, stability of the analyte, minimum required dilution (MRD).
Bioanalytical method development does not require extensive record keeping or notation. Once the method has been developed, bioanalytical method validation proves that the method is suited to the analysis of the study samples.
If a problem is encountered with the method during the analysis of nonclinical or clinical study samples that requires that the analysis be stopped, any changes to the method and the rationale should be documented.
2.2 Method Validation
2.2.1 Full Validation
Bioanalytical method validation is essential to ensure the acceptability of assay performance and the reliability of analytical results. A bioanalytical method is defined as a set of procedures used for measuring analyte concentrations in biological samples. A full validation of a bioanalytical method should be performed when establishing a bioanalytical method for the quantification of an analyte in clinical and in applicable nonclinical studies. Full validation should also be performed when implementing an analytical method that is reported in the literature and when a commercial kit is repurposed for bioanalytical use in drug development. Usually, one analyte has to be determined, but on occasion it may be appropriate to measure more than one analyte. This may involve two different drugs, a parent drug with its metabolites or the enantiomers or isomers of a drug. In these cases, the principles of validation and analysis apply to all analytes of interest. For chromatographic methods a full validation should include the following elements, unless otherwise justified: selectivity, specificity, matrix effect, calibration curve (response function), range (lower limit of quantification (LLOQ) to upper limit of quantification (ULOQ)), accuracy, precision, carry-over, dilution integrity, stability and reinjection reproducibility.
For LBAs the following elements should be evaluated, unless otherwise justified: specificity, selectivity, calibration curve (response function), range (LLOQ to ULOQ), accuracy, precision, carry-over, dilution linearity, and stability. If necessary, parallelism can be conducted when appropriate study samples are available.
The assessments that are performed during validation should be relevant to the sample analysis workflow. The matrix used for bioanalytical method validation should be the same as the matrix of the study samples, including anticoagulants and additives. In some cases, it may be difficult to obtain an identical matrix to that of the study samples (e.g., rare matrices such as tissue, cerebrospinal fluid, bile or in cases where free drug is measured). In such cases, surrogate matrices may be acceptable for analytical method validation.
The choice of surrogate matrix should be scientifically justified. Matrix differences within species (e.g., age, ethnicity, gender) are generally not considered different when validating a method.
A specific, detailed, written description of the bioanalytical method and validation procedure should be established a priori. This description may be in the form of a protocol, study plan, report, notebook or Standard Operating Procedure (SOP).
2.2.2 Partial Validation
Modifications to a fully validated analytical method may be evaluated by partial validation. Partial validation can range from as little as one accuracy and precision determination to a nearly full validation (Refer to Section 6.1). The items in a partial validation should be determined according to the extent and nature of the changes made to the method.
2.2.3 Cross Validation
Cross validation is required to demonstrate how the reported data are related when multiple bioanalytical methods and/or multiple bioanalytical laboratories are involved. (Refer to Section 6.2)
3. CHROMATOGRAPHY
3.1 Reference Standards
During method validation and the analysis of study samples, a blank biological matrix is spiked with the analyte(s) of interest using solutions of reference standard(s) to prepare calibration standards and QCs. Calibration standards and QCs should be prepared from separate stock solutions. However, calibration standards and QCs may be prepared from the same stock solution provided the accurate preparation and stability of the stock solution should have been verified.
A suitable internal standard (IS) should be added to all calibration standards, QCs and study samples during sample processing. The absence of an IS should be justified.
It is important that the reference standard is well characterised and the quality (e.g., purity, identity) of the reference standard and the suitability of the IS is ensured, as the quality will affect the outcome of the analysis and, therefore, the study data. The reference standard used during validation and study sample analysis should be obtained from an authentic and traceable source. The reference standard should be identical to the analyte. If this is not possible, an established form (e.g., salt or hydrate) of known quality should be used.
Suitable reference standards include compendial standards, commercially available standards or sufficiently characterised standards prepared in-house or by an external organisation. A certificate of analysis (CoA) or an equivalent alternative is required to ensure quality and to provide information on the purity, storage conditions, retest/expiration date and batch number of the reference standard.
A CoA is not required for the IS as long as the suitability for use is demonstrated, e.g., a lack of analytical interference is shown for the substance itself or any impurities thereof.
When MS detection is used, the use of the stable isotope-labelled analyte as the IS is recommended whenever possible. However, it is essential that the labelled standard is of high isotope purity and that no isotope exchange reaction occurs. The presence of unlabelled analyte should be checked and if unlabelled analyte is detected, the potential influence should be evaluated during method validation.
Stock and working solutions should only be prepared from reference standards that are within the stability period as documented in the CoA (either expiration date or the retest date).
3.2 Validation
3.2.1 Selectivity
Selectivity is the ability of an analytical method to differentiate and measure the analyte in the presence of potential interfering substances in the blank biological matrix.
Selectivity should be evaluated using blank samples (matrix samples processed without addition of an analyte or IS) obtained from at least 6 individual sources/lots (non-haemolysed and non-lipaemic). Use of fewer sources may be acceptable in the case of rare matrices. Selectivity for the IS should also be evaluated.
The evaluation of selectivity should demonstrate that no significant response attributable to interfering components is observed at the retention time(s) of the analyte or the IS in the blank samples. Responses attributable to interfering components should not be more than 20% of the analyte response at the LLOQ and not more than 5% of the IS response in the LLOQ sample for each matrix.
For the investigation of selectivity in lipaemic matrices at least one source of matrix should be used. To be scientifically meaningful, the matrix used for these tests should be representative as much as possible of the expected study samples. A naturally lipaemic matrix with abnormally high levels of triglycerides should be obtained from donors. Although it is recommended to use lipaemic matrix from donors, if this is difficult to obtain, matrix can be spiked with triglycerides even though it may not be representative of study samples. However, if the drug impacts lipid metabolism or if the intended patient population is hyperlipidaemic, the use of spiked samples is discouraged. This evaluation is not necessary for nonclinical studies unless the drug impacts lipid metabolism or is administered in a particular animal strain that is hyperlipidaemic.
For the investigation of selectivity in haemolysed matrices at least one source of matrix should be used. Haemolysed matrices should be obtained by spiking matrix with haemolysed whole blood (at least 2% V/V) to generate a visibly detectable haemolysed sample.
3.2.2 Specificity
Specificity is the ability of a bioanalytical method to detect and differentiate the analyte from other substances, including its related substances (e.g., substances that are structurally similar to the analyte, metabolites, isomers, impurities, degradation products formed during sample preparation, or concomitant medications that are expected to be used in the treatment of patients with the intended indication).
If the presence of related substances is anticipated in the biological matrix of interest, the impact of such substances should be evaluated during method validation, or alternatively, in the pre- dose study samples. In the case of LC-MS based methods, to assess the impact of such substances, the evaluation may include comparing the molecular weight of a potential interfering related substance with the analyte and chromatographic separation of the related substance from the analyte.
Responses detected and attributable to interfering components should not be more than 20% of the analyte response at the LLOQ and not more than 5% of the IS response in the LLOQ sample.
The possibility of back-conversion of a metabolite into the parent analyte during the successive steps of the analysis (including extraction procedures or in the MS source) should also be evaluated when relevant (e.g., potentially unstable metabolites such as ester analytes to ester/acidic metabolites, unstable N-oxides or glucuronide metabolites, lactone-ring structures). It is acknowledged that this evaluation will not be possible in the early stages of drug development of a new chemical entity when the metabolism is not yet evaluated. However, it is expected that this issue should be investigated, and partial validation performed if needed. The extent of back-conversion, if any, should be established and the impact on the study results should be discussed in the Bioanalytical Report.
3.2.3 Matrix Effect
A matrix effect is defined as an alteration of the analyte response due to interfering and often unidentified component(s) in the sample matrix. During method validation the matrix effect between different independent sources/lots should be evaluated.
The matrix effect should be evaluated by analysing at least 3 replicates of low and high QCs, each prepared using matrix from at least 6 different sources/lots. For each individual matrix
sources/lots evaluated, the accuracy should be within ±15% of the nominal concentration and the precision (per cent coefficient of variation (%CV)) should not be greater than 15%. Use of fewer sources/lots may be acceptable in the case of rare matrices.
The matrix effect should also be evaluated in relevant patient populations or special populations (e.g., hepatically impaired or renally impaired) when available. An additional evaluation of the matrix effect is recommended using haemolysed or lipaemic matrix samples during method validation on a case-by-case basis, especially when these conditions are expected to occur within the study.
3.2.4 Calibration Curve and Range
The calibration curve demonstrates the relationship between the nominal analyte concentration and the response of the analytical platform to the analyte. Calibration standards, prepared by spiking matrix with a known quantity of analyte(s), span the calibration range and comprise the calibration curve. Calibration standards should be prepared in the same biological matrix as the study samples. The calibration range is defined by the LLOQ, which is the lowest calibration standard, and the ULOQ, which is the highest calibration standard. There should be one calibration curve for each analyte studied during method validation and for each analytical run.
A calibration curve should be generated with a blank sample, a zero sample (blank sample spiked with IS), and at least 6 concentration levels of calibration standards, including the LLOQ and the ULOQ.
A simple regression model that adequately describes the concentration-response relationship should be used. The selection of the regression model should be directed by written procedures. The regression model, weighting scheme and transformation should be determined during the method validation. Blank and zero samples should not be included in the determination of the regression equation for the calibration curve. Each calibration standard may be analysed in replicate, in which case data from all acceptable replicates should be used in the regression analysis.
The calibration curve parameters should be reported (e.g., slope and intercept in the case of a linear model). The back-calculated concentrations of the calibration standards should be presented together with the calculated mean accuracy and precision values. All acceptable curves obtained during validation, based on a minimum of 3 independent runs over several days, should be reported. The accuracy of the back-calculated concentrations of each calibration standard should be within ±20% of the nominal concentration at the LLOQ and within ±15%
at all the other levels. At least 75% of the calibration standards with a minimum of 6 calibration standard levels should meet the above criteria.
In the case that replicates are used, the criteria (within ±15% or ±20% for LLOQ) should also be fulfilled for at least 50% of the calibration standards tested per concentration level. In the case that a calibration standard does not comply with these criteria, this calibration standard sample should be rejected, and the calibration curve without this calibration standard should be re-evaluated, including regression analysis. For accuracy and precision runs, if all replicates of the LLOQ or the ULOQ calibration standard in a run are rejected, then the run should be rejected, the possible source of the failure should be determined and the method revised, if necessary. If the next validation run also fails, then the method should be revised before restarting validation.
The calibration curve should be prepared using freshly spiked calibration standards in at least one assessment. Subsequently, frozen calibration standards can be used within their defined period of stability.
3.2.5 Accuracy and Precision
3.2.5.1 Preparation of Quality Control Samples
The QCs are intended to mimic study samples and should be prepared by spiking matrix with a known quantity of analyte, storing them under the conditions anticipated for study samples and analysing them to assess the validity of the analytical method.
Calibration standards and the QCs should be prepared from separate stock solutions in order to avoid biased estimations which are not related to the analytical performance of the method. If calibration standards and the QCs may be prepared from the same stock solution, the accuracy and stability of the stock solution should be verified. A single source of blank matrix may be used, which should be free of interference or matrix effects, as described in Section 3.2.3.
During method validation the QCs for accuracy and precision runs should be prepared at a minimum of 4 concentration levels within the calibration curve range: the LLOQ, within three times of the LLOQ (low QC), around 30 - 50% of the calibration curve range (medium QC) and at least 75% of the ULOQ (high QC).
For non-accuracy and precision validation runs, low, medium and high QCs may be analysed in duplicate. These QCs, along with the calibration standards, will provide the basis for the acceptance or rejection of the run.
3.2.5.2 Evaluation of Accuracy and Precision
Accuracy and precision should be determined by analysing the QCs within each run (within- run) and in different runs (between-run). Accuracy and precision should be evaluated using the same runs and data.
Within-run accuracy and precision should be evaluated by analysing at least 5 replicates at each QC concentration level in each analytical run. Between-run accuracy and precision should be evaluated by analysing each QC concentration level in at least 3 analytical runs over at least two days. To enable the evaluation of any trends over time within one run, it is recommended to demonstrate accuracy and precision of the QCs over at least one of the runs in a size equivalent to a prospective analytical run of study samples. Reported method validation data and the determination of accuracy and precision should include all results obtained, including individual QCs outside of the acceptance criteria, except those cases where errors are obvious and documented. Within-run accuracy and precision data should be reported for each run. If the within-run accuracy or precision criteria are not met in all runs, an overall estimate of within- run accuracy and precision for each QC level should be calculated. Between-run (intermediate) precision and accuracy should be calculated by combining the data from all runs.
The calibration curves for these assessments should be prepared using freshly spiked calibration standards in at least one run. If freshly spiked calibration standards are not used in the other runs, stability of the frozen calibration standards should be demonstrated.
The accuracy at each concentration level should be within ±15% of the nominal concentration, except at the LLOQ, where it should be within ±20%. The precision (%CV) of the concentrations determined at each level should not exceed 15%, except at the LLOQ, where it should not exceed 20%. For non-accuracy and precision validation runs, at least 2/3 of the total QCs and at least 50% at each concentration level should be within ±15% of the nominal values.
3.2.6 Carry-over
Carry-over is an alteration of a measured concentration due to residual analyte from a preceding sample that remains in the analytical instrument.
Carry-over should be assessed and minimised during method development. During validation carry-over should be assessed by analysing blank samples after the calibration standard at the ULOQ. Carry-over in the blank samples following the highest calibration standard should not be greater than 20% of the analyte response at the LLOQ and 5% of the response for the IS. If it appears that carry-over is unavoidable, study samples should not be randomised. Specific measures should be considered, validated and applied during the analysis of the study samples,
so that carry-over does not affect accuracy and precision. This could include the injection of blank sample(s) after samples with an expected high concentration, before the next study sample.
3.2.7 Dilution Integrity
Dilution integrity is the assessment of the sample dilution procedure, when required, to confirm that it does not impact the accuracy and precision of the measured concentration of the analyte. The same matrix from the same species used for preparation of the QCs should be used for dilution.
Dilution QCs should be prepared with analyte concentrations in matrix that are greater than the ULOQ and then diluted with blank matrix. At least 5 replicates per dilution factor should be tested in one run to determine if concentrations are accurately and precisely measured within the calibration range. The dilution factor(s) and concentrations applied during study sample analysis should be within the range of the dilution factors and concentrations evaluated during validation. The mean accuracy of the dilution QCs should be within ±15% of the nominal concentration and the precision (%CV) should not exceed 15%.
In the cases of rare matrices, use of a surrogate matrix for dilution may be acceptable. It should be demonstrated that this does not affect precision and accuracy.
3.2.8 Stability
Stability evaluations should be carried out to ensure that every step taken during sample preparation, processing and analysis as well as the storage conditions used do not affect the concentration of the analyte.
The storage and analytical conditions applied to the stability tests, such as the sample storage times and temperatures, sample matrix, anticoagulant and container materials, should reflect those used for the study samples. Reference to data published in the literature is not considered sufficient. Validation of storage periods should be performed on QCs that have been stored for a time that is equal to or longer than the study sample storage periods.
Stability of the analyte in the matrix is evaluated using low and high concentration QCs. Aliquots of the low and high QCs are analysed at time zero and after the applied storage conditions that are to be evaluated. One bulk QC should be prepared at each concentration level. For each concentration tested, the bulk sample should be divided into a minimum of 3 aliquots that will be stored, stressed and analysed.
The QCs should be analysed against a calibration curve, obtained from freshly spiked calibration standards in a run with its corresponding freshly spiked QCs or QCs for which stability has been proven. The mean concentration at each QC level should be within ±15% of the nominal concentration. If the concentrations of the study samples are consistently higher than the ULOQ of the calibration range, the concentration of the high QC should be adjusted to reflect these higher concentrations. It is recognised that this may not be possible in nonclinical studies due to solubility limitations.
For fixed dose combination products and specifically labelled drug regimens, the freeze-thaw, bench-top and long-term stability tests of an analyte in matrix should be conducted with the matrix spiked with all of the dosed compounds.
The following stability tests should be evaluated:
1) Stability of the Analyte in Matrix Freeze-Thaw Stability in Matrix
To assess the impact of repeatedly removing samples from frozen storage, the stability of
the analyte should be assessed after multiple cycles of freezing and thawing. Low and high QCs should be thawed and analysed according to the same procedures as the study samples. QCs should be kept frozen for at least 12 hours between the thawing cycles. QCs for freeze- thaw stability should be assessed using freshly prepared calibration standards and QCs, or QCs for which stability has been proven. The number of freeze-thaw cycles validated should equal or exceed that of the freeze-thaw cycles undergone by the study samples, but a minimum of three cycles should be conducted.
Bench-Top (short-term) Stability in Matrix
Bench top matrix stability experiments should be designed and conducted to cover the laboratory handling conditions for the study samples.
Low and high QCs should be thawed in the same manner as the study samples and kept on the bench top at the same temperature and for at least the same duration as the study samples.
The total time on the bench top should be concurrent; it is not acceptable to use additive exposure to bench top conditions (i.e., time from each freeze-thaw evaluation should not be added up).
Long-Term Stability in Matrix
The long-term stability of the analyte in matrix stored in the freezer should be established. Low and high QCs should be stored in the freezer under the same storage conditions and at least for the same duration as the study samples.
For chemical drugs, the stability at one temperature (e.g., -20°C) to can be extrapolated to lower temperatures (e.g., -70/-80°C).
For biological drugs, a bracketing approach can be applied, e.g., in the case that the stability has been demonstrated at -70/-80°C and at -20°C, then it is not necessary to investigate the stability at temperatures in between those two points at which study samples will be stored.
2) Stability of the Analyte in Processed Samples
The stability of processed samples, including the time until completion of analysis (in the autosampler/instrument), should be determined. For example:
• Stability of the processed sample under the storage conditions to be used during the analysis of study samples (dry extract or in the injection phase)
• On-instrument/autosampler stability of the processed sample at injector or autosampler temperature.
The total time that a processed sample is stored must be concurrent (i.e., autosampler and other storage times cannot be added together).
3) Stability of the Analyte and IS in Stock and Working Solutions
The stability of the stock and working solutions of the analyte and IS should be determined under the storage conditions used during the analysis of study samples by using the lowest and the highest concentrations of these solutions. They should be assessed using the response of the detector. Stability of the stock and working solutions should be tested with an appropriate dilution, taking into consideration the linearity and measuring range of the detector. If the stability varies with concentration, then the stability of all concentrations of the stock and working solutions needs to be assessed. If no isotopic exchange occurs for the stable isotopically-labelled IS under the same storage conditions as the analyte for which the stability is demonstrated, then no additional stability determinations for the IS are necessary. If the reference standard expires, or it is past the retest date, the stability of the stock solutions made previously with this lot of reference standard are defined by the expiration or retest date established for the stock solution. The practice of making stock and
working solutions from reference standards solely for extending the expiry date for the use of the reference standard is not acceptable.
In addition, the following test should be performed if applicable:
4) Stability of the Analyte in Whole Blood
Sufficient attention should be paid to the stability of the analyte in the sampled matrix (blood) directly after collection from subjects and prior to preparation for storage to ensure that the concentrations obtained by the analytical method reflect the concentrations of the analyte in the subject’s blood at the time of sample collection.
If the matrix used is plasma, the stability of the analyte in blood should be evaluated during method development (e.g., using an exploratory method in blood) or during method validation. The results should be provided in the Validation Report.
3.2.9 Reinjection Reproducibility
Reproducibility of the method is assessed by replicate measurements of the QCs and is usually included in the assessment of precision and accuracy. However, if samples could be reinjected (e.g., in the case of instrument interruptions or other reasons such as equipment failure), reinjection reproducibility should be evaluated to establish the viability of the processed samples and to support their storage prior to reinjection.
Reinjection reproducibility is assessed by reinjecting a run that is comprised of calibration standards and a minimum of 5 replicates of the low, middle and high QCs after storage. The precision and accuracy of the reinjected QCs establish the viability of the processed samples.
The results should be included in the Validation Report or provided in the Bioanalytical Report of the study where it was conducted.
3.3 Study Sample Analysis
The analysis of study samples can be carried out after validation has been completed, however, it is understood that some parameters may be completed at a later stage (e.g., long-term stability). By the time the data are submitted to a regulatory authority, the bioanalytical method validation should have been completed. The study samples, QCs and calibration standards should be processed in accordance with the validated analytical method. If system suitability is assessed, a predefined specific study plan, protocol or SOP should be used. System suitability, including apparatus conditioning and instrument performance, should be determined using samples that are independent of the calibration standards and QCs for the run. Subject samples
should not be used for system suitability. The IS responses of the study samples should be monitored to determine whether there is systemic IS variability. Refer to Table 1 for expectations regarding documentation.
3.3.1 Analytical Run
An analytical run consists of a blank sample (processed matrix sample without analyte and without IS), a zero sample (processed matrix with IS), calibration standards at a minimum of 6 concentration levels, at least 3 levels of QCs (low, medium and high) in duplicate (or at least 5% of the number of study samples, whichever is higher) and the study samples to be analysed. The QCs should be interspersed in the run in such a way that the accuracy and precision of the whole run is ensured. Study samples should always be bracketed by QCs.
The calibration standards and QCs should be spiked independently using separately prepared stock solutions, unless the accuracy and stability of the stock solutions have been verified. All samples (calibration standards, QCs and study samples) should be processed and extracted as one single batch of samples in the order in which they are intended to be analysed. Analysing samples that were processed as several separate batches in a single analytical run is discouraged. If such an approach cannot be avoided, for instance due to bench top stability limitations, each batch of samples should include low, medium and high QCs.
For comparative BA/BE studies, it is advisable to analyse all samples of one subject together in one analytical run to reduce variability.
The impact of any carry-over that occurs during study sample analysis should be assessed and reported (Refer to Section 3.2.6). If carry-over is detected, its impact on the measured concentrations should be mitigated (e.g., non-randomisation of study samples, injection of blank samples after samples with an expected high concentration) or the validity of the reported concentrations should be justified in the Bioanalytical Report.
3.3.2 Acceptance Criteria for an Analytical Run
Criteria for the acceptance or rejection of an analytical run should be defined in the protocol, in the study plan or in an SOP. In the case that a run contains multiple batches, acceptance criteria should be applied to the whole run and to the individual batches. It is possible for the run to meet acceptance criteria, even if a batch within that run is rejected for failing to meet the batch acceptance criteria. Calibration standards in a failed batch cannot be used to support the acceptance of other batches within the analytical run.
The back-calculated concentrations of the calibration standards should be within ±15% of the nominal value, except for the LLOQ for which it should be within ±20%. At least 75% of the calibration standard concentrations, which should include a minimum of six concentration levels, should fulfil these criteria. If more than six calibration standard levels are used and one of the calibration standards does not meet the criteria, this calibration standard should be rejected and the calibration curve without this calibration standard should be re-evaluated and a new regression analysis performed.
If the rejected calibration standard is the LLOQ, the new lower limit for this analytical run is the next lowest acceptable calibration standard of the calibration curve. This new lower limit calibration standard will retain its original acceptance criteria (i.e., ±15%). If the highest calibration standard is rejected, the ULOQ for this analytical run is the next acceptable highest calibration standard of the calibration curve. The revised calibration range should cover at least 3 QC concentration levels (low, medium and high). Study samples outside of the revised range should be reanalysed. If replicate calibration standards are used and only one of the LLOQ or ULOQ standards fails, the calibration range is unchanged.
At least 2/3 of the total QCs and at least 50% at each concentration level should be within ±15% of the nominal values. If these criteria are not fulfilled the analytical run should be rejected. A new analytical batch should be prepared for all study samples within the failed analytical run for subsequent analysis. In the cases where the failure is due to an assignable technical cause, samples may be reinjected.
Analytical runs containing samples that are diluted and reanalysed, should include dilution QCs to verify the accuracy and precision of the dilution method during study sample analysis. The concentration of the dilution QCs should exceed that of the study samples being diluted (or of the ULOQ) and they should be diluted using the same dilution factor. If multiple dilution factors are used in one analytical run, then dilution QCs need only be diluted by the highest and lowest dilution factors. The within-run accepta,nce criteria of the dilution QC(s) will only affect the acceptance of the diluted study samples and not the outcome of the analytical run.
When several analytes are assayed simultaneously, there should be one calibration curve for each analyte studied. If an analytical run is acceptable for one analyte but has to be rejected for another analyte, the data for the accepted analyte should be used. The determination of the rejected analyte requires re-extraction and analysis only for the analyte that is reanalysed. Only data for this reanalysed analyte needs to be reported.
The back-calculated concentrations of the calibration standards and QCs of passed and accepted runs should be reported. The overall (between-run) accuracy and precision of the QCs of all
accepted runs should be calculated at each concentration level and reported in the analytical report (Refer to Section 8 Documentation and Table 1). If the overall mean accuracy and/or precision fails the 15% criterion, an investigation to determine the cause of the deviation should be conducted. In the case of comparative BA/BE studies, it may result in the rejection of the data.
3.3.3 Calibration Range
If a narrow range of analyte concentrations of the study samples is known or anticipated before the start of study sample analysis, it is recommended to either narrow the calibration curve range, adapt the concentrations of the QCs, or add new QCs at different concentration levels as appropriate, to adequately reflect the concentrations of the study samples.
At the intended therapeutic dose(s), if an unanticipated clustering of study samples at one end of the calibration curve is encountered after the start of sample analysis, the analysis should be stopped and either the standard calibration range narrowed (i.e., partial validation), existing QC concentrations revised, or QCs at additional concentrations added to the original curve within the observed range before continuing with study sample analysis. It is not necessary to reanalyse samples analysed before optimising the calibration curve range or QC concentrations.
The same applies if a large number of the analyte concentrations of the study samples are above the ULOQ. The calibration curve range should be changed, if possible, and QC(s) added or their concentrations modified. If it is not possible to change the calibration curve range or the number of samples with a concentration above the ULOQ is not large, samples should be diluted according to the validated dilution method.
At least 2 QC levels should fall within the range of concentrations measured in study samples. If the calibration curve range is changed, the bioanalytical method should be revalidated (partial validation) to verify the response function and to ensure accuracy and precision.
3.3.4 Reanalysis of Study Samples
Possible reasons for reanalysis of study samples, the number of replicates and the decision criteria to select the value to be reported should be predefined in the protocol, study plan or SOP, before the actual start of the analysis of the study samples. For study samples in which multiple analytes are being analysed, a valid result for one analyte should not be rejected if the other analyte fails the acceptance criteria.
The number of samples (and percentage of total number of samples) that have been reanalysed should be reported and discussed in the Bioanalytical Report. For comparative BA/BE studies, a separate table should report values from rejected runs.
Some examples of reasons for study sample reanalysis are:
• Rejection of an analytical run because the run failed the acceptance criteria with regard to accuracy of the calibration standards and/or the precision and accuracy of the QCs
• IS response significantly different from the response for the calibration standards and QCs (as pre-defined in an SOP)
• The concentration obtained is above the ULOQ
• The concentration observed is below the revised LLOQ in runs where the lowest calibration standard has been rejected from a calibration curve, resulting in a higher LLOQ compared with other runs
• Improper sample injection or malfunction of equipment
• The diluted study sample is below the LLOQ
• Identification of quantifiable analyte levels in pre-dose samples, control or placebo samples
• Poor chromatography (as pre-defined in an SOP)
For comparative BA/BE studies, reanalysis of study samples for a PK reason (e.g., a sample concentration does not fit with the expected profile) is not acceptable, as it may bias the study result.
Any reanalysed samples should be identified in the Bioanalytical Report and the initial value, the reason for reanalysis, the values obtained in the reanalyses, the final accepted value and a justification for the acceptance should be provided. Further, a summary table of the total number of samples that have been reanalysed for each reason should be provided. In cases where the first analysis yields a non-reportable result, a single reanalysis is considered sufficient (e.g., concentration above the ULOQ or equipment malfunction). In cases where the value needs to be confirmed (e.g., pre-dose sample with measurable concentrations) replicate determinations are required if sample volume allows.
The safety of trial subjects should take precedence over any other aspect of the trial. Consequently, there may be other circumstances when it is necessary to reanalyse specific study samples for the purpose of a safety investigation.
3.3.5 Reinjection of Study Samples
Reinjection of processed samples can be made in the case of equipment failure if reinjection reproducibility has been demonstrated during validation or provided in the Bioanalytical Report where it was conducted. Reinjection of a full analytical run or of individual calibration standards or QCs simply because the calibration standards or QCs failed, without any identified analytical cause, is not acceptable.
3.3.6 Integration of Chromatograms
Chromatogram integration and reintegration should be described in a study plan, protocol or SOP. Any deviation from the procedures described a priori should be discussed in the Bioanalytical Report. The list of chromatograms that required reintegration, including any manual integrations, and the reasons for reintegration should be included in the Bioanalytical Report. Original and reintegrated chromatograms and initial and repeat integration results should be kept for future reference and submitted in the Bioanalytical Report for comparative BA/BE studies.
4. LIGAND BINDING ASSAYS
4.1 Key Reagents
4.1.1 Reference Standard
The reference standard should be well characterised and documented (e.g., CoA and origin). A biological drug has a highly complex structure and its reactivity with binding reagents for bioanalysis may be influenced by a change in the manufacturing process of the drug substance. It is recommended that the manufacturing batch of the reference standard used for the preparation of calibration standards and QCs is derived from the same batch of drug substance as that used for dosing in the nonclinical and clinical studies whenever possible. If the reference standard batch used for bioanalysis is changed, bioanalytical evaluation should be carried out with QCs from the original material and the new material prior to use to ensure that the performance characteristics of the method are within the acceptance criteria.
4.1.2 Critical Reagents
Critical reagents, including binding reagents (e.g., binding proteins, aptamers, antibodies or conjugated antibodies) and those containing enzymatic moieties, have direct impact on the results of the assay and, therefore, their quality should be assured. Critical reagents bind the analyte and, upon interaction, lead to an instrument signal corresponding to the analyte concentration. The critical reagents should be identified and defined in the assay method.
Reliable procurement of critical reagents, whether manufactured in-house or purchased commercially, should be considered early in method development. The data sheet for the critical reagent should include at a minimum identity, source, batch/lot number, purity (if applicable), concentration (if applicable) and stability/retest date/storage conditions (Refer to Table 1). Additional characteristics may be warranted.
A critical reagent lifecycle management procedure is necessary to ensure consistency between the original and new batches of critical reagents. Reagent performance should be evaluated using the bioanalytical method. Minor changes to critical reagents would not be expected to influence the method performance, whereas major changes may significantly impact the performance. If the change is minor (e.g., the source of one reagent is changed), a single comparative accuracy and precision assessment is sufficient for characterisation. If the change is major, then additional validation experiments are necessary. Ideally, assessment of changes will compare the method with the new reagents to the method with the old reagents directly. Major changes include, but are not limited to, change in production method of antibodies, additional blood collection from animals for polyclonal antibodies and new clones or new supplier for monoclonal antibody production.
Retest dates and validation parameters should be documented in order to support the extension or replacement of the critical reagent. Stability testing of the reagents should be based upon the performance in the bioanalytical method and upon general guidance for reagent storage conditions. It can be extended beyond the expiry date from the supplier. The performance parameters should be documented in order to support the extension or replacement of the critical reagent.
4.2 Validation
Most often microtitre plates are used for LBAs and study samples can be analysed using an assay format of 1 or more well(s) per sample. The assay format should be specified in the protocol, study plan or SOP. If method development and method validation are performed using 1 or more well(s) per sample, then study sample analysis should also be performed using 1 or more well(s) per sample, respectively. If multiple wells per sample are used, the reportable sample concentration should be determined either by calculating the mean of the responses from the replicate wells or by averaging the concentrations calculated from each response. Data evaluation should be performed on reportable concentrations.
4.2.1 Specificity
Specificity is related to the concept of cross-reactivity in LBA. It is important that the binding reagent specifically binds to the target analyte but does not cross-react with coexisting structurally related molecules (e.g., endogenous compounds, isoforms or structurally related concomitant medication). Specificity is evaluated by spiking blank matrix samples with related molecules at the maximal concentration(s) of the structurally related molecule anticipated in study samples.
The accuracy of the target analyte at the LLOQ and at the ULOQ should be investigated in the presence of related molecules at the maximal concentration(s) anticipated in study samples. The response of blank samples spiked with related molecules should be below the LLOQ. The accuracy of the target analyte in presence of related molecules should be within ±25% of the nominal values.
In the event of non-specificity, the impact on the method should be evaluated by spiking increasing concentrations of interfering molecules in blank matrix and measuring the accuracy of the target analyte at the LLOQ and ULOQ. It is essential to determine the minimum concentration of the related molecule where interference occurs. Appropriate mitigation during sample analysis should be employed, e.g., it may be necessary to adjust the LLOQ/ULOQ accordingly or consider a new method.
During method development and early method validation, these “related molecules” are frequently not available. Additional evaluation of specificity may be conducted after the original validation is completed.
4.2.2 Selectivity
Selectivity is the ability of the method to detect and differentiate the analyte of interest in the presence of non-specific matrix components. The matrix can contain non-specific matrix component such as degrading enzymes, heterophilic antibodies or rheumatoid factor which may interfere with the analyte of interest.
Selectivity should be evaluated at the low end of an assay where problems occur in most cases, but it is recommended that selectivity is also evaluated at higher analyte concentrations. Therefore, selectivity is evaluated using blank samples obtained from at least 10 individual sources and by spiking the individual blank matrices at the LLOQ and at the high QC level. Use of fewer sources may be acceptable in the case of rare matrices. The response of the blank samples should be below the LLOQ in at least 80% of the individual sources.
The accuracy should be within ±25% at the LLOQ and within ±20% at the high QC level of the nominal concentration in at least 80% of the individual sources evaluated.
Selectivity should be evaluated in lipaemic samples and haemolysed samples (Refer to Section 3.2.1). For lipaemic and haemolysed samples, tests can be evaluated once using a single source of matrix. Selectivity should be assessed in samples from relevant patient populations (e.g., renally or hepatically impaired patients, inflammatory or immuno-oncology patients if applicable). In the case of relevant patient populations, there should be at least five individual patients.
4.2.3 Calibration Curve and Range
The calibration curve demonstrates the relationship between the nominal analyte concentration and the response of the analytical platform to the analyte. Calibration standards, prepared by spiking matrix with a known quantity of analyte, span the calibration range and comprise the calibration curve. Calibration standards should be prepared in the same biological matrix as the study samples. The calibration range is defined by the LLOQ, which is the lowest calibration standard, and the ULOQ, which is the highest calibration standard. There should be one calibration curve for each analyte studied during method validation and for each analytical run. If needed, the use of surrogate matrix should be scientifically justified.
A calibration curve should be generated with at least 6 concentration levels of calibration standards, including LLOQ and ULOQ standards, plus a blank sample. The blank sample should not be included in the calculation of calibration curve parameters. Anchor point samples at concentrations below the LLOQ and above the ULOQ of the calibration curve may also be used to improve curve fitting. The relationship between response and concentration for a calibration curve is most often fitted by a 4- or 5-parameter logistic model if there are data points near the lower and upper asymptotes. Oher models should be suitably justified.
A minimum of 6 independent runs should be evaluated over several days considering the factors that may contribute to between-run variability.
The accuracy and precision of back-calculated concentrations of each calibration standard should be within ±25% of the nominal concentration at the LLOQ and ULOQ, and within ±20% at all other levels. At least 75% of the calibration standards excluding anchor points, and a minimum of 6 concentration levels of calibration standards, including the LLOQ and ULOQ, should meet the above criteria. The anchor points do not require acceptance criteria since they are beyond the quantifiable range of the curve.
The calibration curve should preferably be prepared using freshly spiked calibration standards. If freshly spiked calibration standards are not used, the frozen calibration standards can be used within their defined period of stability.
4.2.4 Accuracy and Precision
4.2.4.1 Preparation of Quality Control Samples
The QCs are intended to mimic study samples and should be prepared by spiking matrix with a known quantity of analyte, stored under the conditions anticipated for study samples and analysed to assess the validity of the analytical method.
The dilution series for the preparation of the QCs should be completely independent from the dilution series for the preparation of calibration standard samples. They may be prepared from the same stock solution (or working stock) provided the accurate preparation and stability have been verified. The QCs should be prepared at a minimum of 5 concentration levels within the calibration curve range: The analyte should be spiked at the LLOQ, within three times of the LLOQ (low QC), around the geometric mean of the calibration curve range (medium QC), and at least at 75% of the ULOQ (high QC) and at the ULOQ.
For non-accuracy and precision validation runs, low, medium and high QCs may be analysed in duplicate. These QCs, along with the calibration standards, will provide the basis for the acceptance or rejection of the run.
4.2.4.2 Evaluation of Accuracy and Precision
Accuracy and precision should be determined by analysing the QCs within each run (within- run) and in different runs (between-run). Accuracy and precision should be evaluated using the same runs and data.
Accuracy and precision should be determined by analysing at least 3 replicates per run at each QC concentration level (LLOQ, low, medium, high, ULOQ) in at least 6 runs over 2 or more days. Reported method validation data and the determination of accuracy and precision should include all results obtained, except those cases where errors are obvious and documented. Within-run accuracy and precision data should be reported for each run. If the within-run accuracy or precision criteria are not met in all runs, an overall estimate of within-run accuracy and precision for each QC level should be calculated. Between-run (intermediate) precision and accuracy should be calculated by combining the data from all runs.
The overall within-run and between-run accuracy at each concentration level should be within
±20% of the nominal values, except for the LLOQ and ULOQ, which should be within ±25%
of the nominal value. Within-run and between-run precision of the QC concentrations determined at each level should not exceed 20%, except at the LLOQ and ULOQ, where it should not exceed 25%.
For non-accuracy and precision validation runs, at least 2/3 of the total QCs and at least 50% at each concentration level should be within ±20% of the nominal values.
Furthermore, the total error (i.e., sum of absolute values of the errors in accuracy (%) and precision (%)) should be evaluated. The total error should not exceed 30% (40% at LLOQ and ULOQ).
4.2.5 Carry-over
Carry-over is generally not an issue for LBA analyses. However, if the analytical platform is prone to carry-over, the potential of carry-over should be investigated by placing blank samples after the calibration standard at the ULOQ. The response of blank samples should be below the LLOQ.
4.2.6 Dilution Linearity and Hook Effect
Due to the narrow assay range in many LBAs, study samples may require dilution in order to achieve analyte concentrations within the range of the assay. Dilution linearity should be assessed to confirm: (i) that measured concentrations are not affected by dilution within the calibration range and (ii) that sample concentrations above the ULOQ of a calibration curve are not impacted by hook effect (i.e., a signal suppression caused by high concentrations of the analyte), whereby yielding an erroneous result.
The same matrix as that of the study sample should be used for preparation of the QCs for dilution.
Dilution linearity should be demonstrated by generating a dilution QC, i.e., spiking the matrix with an analyte concentration above the ULOQ, analysed undiluted (for hook effect) and diluting this sample (to at least 3 different dilution factors) with blank matrix to a concentration within the calibration range. For each dilution factor tested, at least 3 independently prepared dilution series should be performed using the number of replicates that will be used in sample analysis. The absence or presence of response reduction (hook effect) is checked in the dilution QCs and, if observed and unable to be eliminated with reasonable measures, steps should be taken to mitigate this effect during the analysis of study samples.
The calculated mean concentration for each dilution should be within ±20% of the nominal concentration after correction for dilution and the precision should not exceed 20%.
The dilution factor(s) applied during study sample analysis should be within the range of dilution factors evaluated during validation.
4.2.7 Stability
Stability evaluations should be carried out to ensure that every step taken during sample preparation, processing and analysis as well as the storage conditions used do not affect the concentration of the analyte.
The storage and analytical conditions applied to the stability tests, such as the sample storage times and temperatures, sample matrix, anticoagulant, and container materials should reflect those used for the study samples. Reference to data published in the literature is not considered sufficient. Validation of storage periods should be performed on QCs that have been stored for a time that is equal to or longer than the study sample storage periods.
Stability of the analyte in the studied matrix should be evaluated using low and high concentration QCs. Aliquots of the low and high QCs are analysed at time zero and after the applied storage conditions that are to be evaluated. One bulk QC should be prepared at each concentration level. For each concentration tested, the bulk sample should be divided into a minimum of three aliquots that will be stored, stressed and analysed.
The QCs are analysed against a calibration curve, obtained from freshly spiked calibration standards in a run with its corresponding freshly spiked QCs or QCs for which stability has been proven. While the use of freshly prepared calibration standards and QCs is the preferred approach, it is recognised that in some cases, for macromolecules, it may be necessary to freeze them overnight. In such cases, valid justification should be provided and freeze-thaw stability demonstrated. QCs should be kept frozen for at least 12 hours between the thawing cycles. The mean concentration at each QC level should be within ±20% of the nominal concentration.
Since sample dilution may be required for many LBA methods due to a narrow calibration range, the concentrations of the study samples may be consistently higher than the ULOQ of the calibration curve. If this is the case, the concentration of the QCs should be adjusted, considering the applied sample dilution, to represent the actual sample concentration range.
For fixed dose combination products and specifically labelled drug regimens, the freeze-thaw, bench-top and long-term stability tests of an analyte in matrix should be conducted with the matrix spiked with all of the dosed compounds, on a case-by-case basis.
As mentioned in Section 3.2.8, the investigation of stability should cover bench top (short-term) stability at room temperature or sample preparation temperature and freeze-thaw stability. In addition, long-term stability should be studied.
For chemical drugs, the stability at one temperature (e.g., -20°C) can be extrapolated to lower temperatures (e.g., -70/-80°C).
For biological drugs, a bracketing approach can be applied, e.g., in the case that the stability has been demonstrated at -70/-80°C and at -20°C, then it is not necessary to investigate the stability at temperatures in between those two points at which study samples will be stored.
4.3 Study Sample Analysis
The analysis of study samples can be carried out after validation has been completed, however, it is understood that some parameters may be completed at a later stage (e.g., long-term stability). By the time the data are submitted to a regulatory authority, the bioanalytical method validation should have been completed. The study samples, QCs and calibration standards should be processed in accordance with the validated analytical method. Refer to Table 1 for expectations regarding documentation.
4.3.1 Analytical Run
An analytical run consists of a blank sample, calibration standards at a minimum of 6 concentration levels, at least 3 levels of QCs (low, medium and high) applied as two sets (or at least 5% of the number of study samples, whichever is higher) and the study samples to be analysed. The blank sample should not be included in the calculation of calibration curve parameters. The QCs should be placed in the run in such a way that the accuracy and precision of the whole run is ensured taking into account that study samples should always be bracketed by QCs.
Most often microtitre plates are used for LBAs. An analytical run may comprise of one or more plate(s). Typically, each plate contains an individual set of calibration standards and QCs. If each plate contains its own calibration standards and QCs then each plate should be assessed on its own. However, for some platforms the sample capacity may be limited. In this case, sets of calibration standards may be placed on the first and the last plate, but QCs should be placed on every single plate. QCs should be placed at least at the beginning (before) and at the end (after) of the study samples of each plate. The QCs on each plate and each calibration curve should fulfil the acceptance criteria for an analytical run (Refer to Section 4.3.2). For the calculation of concentrations, the calibration standards should be combined to conduct one
regression analysis. If the combined calibration curve does not pass the acceptance criteria the whole run fails.
4.3.2 Acceptance Criteria for an Analytical Run
Criteria for the acceptance or rejection of an analytical run should be defined in the protocol, in the study plan or in an SOP. In the case that a run contains multiple batches, acceptance criteria should be applied to the whole run and to the individual batches. It is possible for the run to meet acceptance criteria, even if a batch within that run is rejected for failing to meet the batch acceptance criteria. Calibration standards in a failed batch cannot be used to support the acceptance of other batches within the analytical run.
The back-calculated concentrations of the calibration standards should be within ±20% of the nominal value at each concentration level, except for the LLOQ and the ULOQ, for which it should be within ±25%. At least 75% of the calibration standards, with a minimum of 6 concentration levels, should fulfil this criterion. This requirement does not apply to anchor calibration standards. If more than 6 calibration standards are used and one of the calibration standards does not meet these criteria, this calibration standard should be rejected and the calibration curve without this calibration standard should be re-evaluated and a new regression analysis performed.
If the rejected calibration standard is the LLOQ, the new lower limit for this analytical run is the next lowest acceptable calibration standard of the calibration curve. If the highest calibration standard is rejected, the new upper limit for this analytical run is the next acceptable highest calibration standard of the calibration curve. The new lower and upper limit calibration standard will retain their original acceptance criteria (i.e., 20%). The revised calibration range should cover all QCs (low, medium and high). The study samples outside of the revised assay range should be reanalysed.
Each run should contain at least 3 levels of QCs (low, medium and high). During study sample analysis, the calibration standards and QCs should mimic the analysis of the study sample with regard to the number of wells used per study sample. At least 2/3 of the QCs and 50% at each concentration level should be within 20% of the nominal value at each concentration level. Exceptions to these criteria should be justified and predefined in the SOP or protocol.
The overall mean accuracy and precision of the QCs of all accepted runs should be calculated at each concentration level and reported in the analytical report. In the case that the overall mean accuracy and/or precision exceeds 20%, additional investigations should be conducted to
determine the cause(s) of this deviation. In the case of comparative BA/BE studies, it may result in the rejection of the data.
4.3.3 Calibration Range
At least 2 QC sample levels should fall within the range of concentrations measured in study samples. At the intended therapeutic dose(s), if an unanticipated clustering of study samples at one end of the calibration curve is encountered after the start of sample analysis, the analysis should be stopped and either the standard calibration range narrowed (i.e., partial validation), existing QC concentrations revised, or QCs at additional concentrations added to the original curve within the observed range before continuing with study sample analysis. It is not necessary to reanalyse samples analysed before optimising the calibration curve range or QC concentrations.
4.3.4 Reanalysis of Study Samples
Possible reasons for reanalysis of study samples, the number of reanalyses and the decision criteria to select the value to be reported should be predefined in the protocol, study plan or SOP, before the actual start of the analysis of the study samples.
The number of samples (and percentage of total number of samples) that have been reanalysed should be reported and discussed in the Bioanalytical Report. For comparative BA/BE studies, a separate table should report values from rejected runs.
Some examples of reasons for study sample reanalysis are:
• Rejection of an analytical run because the run failed the acceptance criteria with regard to accuracy of the calibration standards and/or the precision and accuracy of the QCs,
• The concentration obtained is above the ULOQ
• The concentration obtained is below the LLOQ in runs where the lowest calibration standard has been rejected from a calibration curve, resulting in a higher LLOQ compared with other runs
• Malfunction of equipment
• The diluted sample is below the LLOQ
• Identification of quantifiable analyte levels in pre-dose samples, control or placebo samples.
• When samples are analysed in more than one well and non-reportable values are obtained due to one replicate failing the pre-defined acceptance criteria (e.g., excessive variability between wells, one replicate being above the ULOQ or below the LLOQ).
For comparative BA/BE studies, reanalysis of study samples for a PK reason (e.g., a sample concentration does not fit with the expected profile) is not acceptable, as it may bias the study result.
The reanalysed samples should be identified in the Bioanalytical Report and the initial value, the reason for reanalysis, the values obtained in the reanalyses, the final accepted value and a justification for the acceptance should be provided. Further, a summary table of the total number of samples that have been reanalysed due to each reason should be provided. In cases where the first analysis yields a non-reportable result, a single reanalysis is considered sufficient (e.g., concentration above the ULOQ or excessive variability between wells). The analysis of the samples should be based on the same number of wells per study sample as in the initial analysis. In cases where the value needs to be confirmed, (e.g., pre-dose sample with measurable concentrations) multiple determinations are required where sample volume allows.
The safety of trial subjects should take precedence over any other aspect of the trial. Consequently, there may be other circumstances when it is necessary to reanalyse specific study samples for the purpose of an investigation.
5. INCURRED SAMPLE REANALYSIS (ISR)
The performance of study samples may differ from that of the calibration standards and QCs used during method validation, which are prepared by spiking blank matrix. Differences in protein binding, back-conversion of known and unknown metabolites, sample inhomogeneity, concomitant medications or biological components unique to the study samples may affect measured concentrations of the analyte in study samples. ISR is intended to verify the reliability of the reported sample analyte concentrations.
ISR should be performed at least in the following situations:
• For nonclinical studies within the scope of this guideline, ISR should, in general, be performed at least once per species.
• All pivotal comparative BA/BE studies
• First clinical trial in subjects
• Pivotal early patient trial(s), once per patient population
• First or pivotal trial in patients with impaired hepatic and/or renal function
ISR is conducted by repeating the analysis of a subset of samples from a given study in separate (i.e., different to the original) runs on different days using the same bioanalytical method.
The extent of ISR depends upon the analyte and the study samples and should be based upon an in-depth understanding of the analytical method and analyte. However, as a minimum, if the total number of study samples is less than or equal to 1000, then 10% of the samples should be reanalysed; if the total number of samples is greater than 1000, then 10% of the first 1000 samples (100) plus 5% of the number of samples that exceed 1000 samples should be assessed. Objective criteria for choosing the subset of study samples for ISR should be predefined in the protocol, study plan or an SOP. While the subjects/animals should be picked as randomly as possible from the dosed study population, adequate coverage of the concentration profile is important. Therefore, it is recommended that the samples for ISR be chosen around the maximum concentration (Cmax) and some in the elimination phase. Additionally, the samples chosen should be representative of the whole study.
Samples should not be pooled, as pooling may limit anomalous findings. ISR samples and QCs should be processed and analysed in the same manner as in the original analysis. ISR should be performed within the stability window of the analyte, but not on the same day as the original analysis.
The percent difference between the initial concentration and the concentration measured during the repeat analysis should be calculated in relation to their mean value using the following equation:
% difference =
repeat value − initial value mean value
× 100
For chromatographic methods, the percent difference should be within ±20% for at least 2/3 of the repeats. For LBAs, the percent difference should be within ± 30% for at least 2/3 of the repeats.
If the overall ISR results fail the acceptance criteria, an investigation should be conducted and the causes remediated. There should be an SOP that directs how investigations are triggered and conducted. If an investigation does not identify the cause of the failure, the potential impact of an ISR failure on study validity should also be provided in the Bioanalytical Report. If ISR meets the acceptance criteria yet shows large or systemic differences between results for multiple samples, this may indicate analytical issues and it is advisable to investigate this further.
Examples of trends that are of concern may include:
• All ISR samples from one subject fail
• All ISR samples from one run fail
All aspects of ISR evaluations should be documented to allow reconstruction of the study and any investigations. Individual samples that are quite different from the original value (e.g., > 50%, “flyers”) should not trigger reanalysis of the original sample and do not need to be investigated. ISR sample data should not replace the original study sample data.
6. PARTIAL AND CROSS VALIDATION
6.1 Partial Validation
Partial validations evaluate modifications to already fully validated bioanalytical methods. Partial validation can range from as little as one within-run accuracy and precision determination, to a nearly full validation. If stability is established at one facility it does not necessarily need to be repeated at another facility.
For chromatographic methods, typical bioanalytical method modifications or changes that fall into this category include, but are not limited to, the following situations:
• Analytical site change using same method (i.e., bioanalytical method transfers between laboratories)
• A change in analytical method (e.g., change in detection systems, platform)
• A change in sample processing procedures
• A change in sample volume (e.g., the smaller volume of paediatric samples)
• Changes to the calibration concentration range
• A change in anticoagulant (but not changes in the counter-ion) in biological fluids (e.g., heparin to ethylenediaminetetraacetic acid (EDTA))
• Change from one matrix within a species to another (e.g., switching from human plasma to serum or cerebrospinal fluid) or changes to the species within the matrix (e.g., switching from rat plasma to mouse plasma)
• A change in storage conditions
For LBAs, typical bioanalytical method modifications or changes that fall into this category include, but are not limited to, the following situations:
• Changes in LBA critical reagents (e.g., lot-to-lot changes)
• Changes in MRD
• A change in storage conditions
• Changes to the calibration concentration range
• A change in analytical method (e.g., change in detection systems, platform)
• Analytical site change using same method (i.e., bioanalytical method transfers between laboratories)
• A change in sample preparation
• A change in anticoagulant (but not changes in the counter-ion) in biological fluids (e.g., heparin to ethylenediaminetetraacetic acid (EDTA))
The parameters of the partial validations should meet the full validation criteria. If these criteria are not satisfied, additional investigation and validation is warranted.
6.2 Cross Validation
Cross validation is required to demonstrate how the reported data are related when multiple bioanalytical methods and/or multiple bioanalytical laboratories are involved.
Cross validation is required under the following situations:
• Data are obtained from different fully validated methods within a study.
• Data are obtained within a study from different laboratories with the same bioanalytical method.
• Data are obtained from different fully validated methods across studies that are going to be combined or compared to support special dosing regimens, or regulatory decisions regarding safety, efficacy and labelling.
If data are obtained from different fully validated methods, and these data are not to be combined across studies, cross validation is not generally required.
Cross validation should be performed in advance of study samples being analysed, if possible.
Cross validation should be assessed by measuring the same set of QCs (low, medium and high) at least in triplicate and study samples (if available) that span the study sample concentration range (n≥30) with both methods, or in both laboratories.
Bias can be assessed by Bland-Altman plots or Deming regression. Other methods appropriate for assessing agreement between two methods (e.g., concordance correlation coefficient) may be used too. Alternatively, the concentration vs. time curves for study samples could be plotted for samples analysed by each method to assess bias.
The use of multiple bioanalytical methods for the measurement of the same analyte in the conduct of one comparative BA/BE study is strongly discouraged.
7. ADDITIONAL CONSIDERATIONS
7.1 Methods for Analytes that are also Endogenous Molecules
For analytes that are also endogenous molecules (e.g., replacement therapies), the accuracy of the measurement of the analytes poses a challenge when the method cannot distinguish between the therapeutic agent and the endogenous molecule. Furthermore, the endogenous levels of the analyte may vary because of age, gender, race, diurnal variations, illness or as side effect of drug treatment. This section describes some of the approaches that may be used to assess concentrations of analytes that are also endogenous molecules. As a reminder, biomarkers are outside of the scope of this guideline.
If available, biological matrix to prepare calibration standards and QCs should be the same as the study samples (i.e., authentic biological matrix) and it should be free of matrix effect and interference, as described in Sections 3 and 4. The endogenous concentration in the biological matrix chosen should be low enough to obtain an adequate signal-to-noise ratio (e.g., <20% of the LLOQ).
In those cases where matrices without interference are not available, the following approaches can be used to calculate the concentration of the analyte in the study samples: 1) the surrogate matrix approach, 2) the surrogate analyte approach, 3) the background subtraction approach and 4) the standard addition approach.
1) Surrogate Matrix Approach:
The matrix for the calibration standards is substituted by a surrogate matrix. Surrogate matrices can vary widely in complexity from simple buffers or artificial matrices that try to mimic the authentic one, to stripped matrices or matrices from other species.
2) Surrogate Analyte Approach:
Stable-isotope labelled analytes are used as surrogate standards in mass spectrometric methods to construct the calibration curve for the quantification of endogenous analytes. In this approach, it is assumed that the physicochemical properties of the authentic and surrogate analytes are the same with the exception of molecular weight. However, isotope standards may differ in retention time and MS sensitivity, therefore, before application of this approach, the ratio of the MS responses (i.e., the response factor) of the labelled to unlabelled analyte should be close to unity and remain constant over the entire calibration range. If the response factor does not comply with these requirements, it should be incorporated into the regression equation of the calibration curve.
3) Background Subtraction Approach:
The concentration of the endogenous analyte observed in a pooled/representative matrix is subtracted from the concentration observed in the spiked standards, subsequently the net differences are used to construct the calibration curve.
When the background concentrations are lowered by dilution of the blank matrices before spiking with the standards (e.g., if a lower LLOQ is required) the composition of the matrices in the study samples and the calibration standards is different, which may cause different recoveries and matrix effects. These differences should be considered when validating the method.
4) Standard Addition Approach:
The standard addition approach is only applicable for analytical platforms with linear responses. Typically, the standard addition method is used to determine the concentration of the endogenous analyte in the authentic matrix to be used for preparation of standards and QCs. However, this approach can be employed for determination of study samples as well. In this approach, every study sample is divided into aliquots of equal volume. All aliquots, but one, are separately spiked with known and varying amounts of the analyte standards to construct a calibration curve for either the authentic blank matrix or every study sample (e.g., with 3 to 5 points). The endogenous blank concentration or the study sample concentration is then determined as the negative x-intercept of the standard calibration curve prepared in that particular study sample.
Validation of an analytical method for an analyte that is also an endogenous compound will require the following considerations, in addition to the validation shown in the Sections 3 and 4.
7.1.1 Quality Control Samples for Methods for Analytes that are also Endogenous Molecules
The endogenous concentrations of the analyte in the biological matrix should be evaluated prior to QC preparation. The matrices with the lowest possible level of the interfering endogenous analyte should be used. The concentrations of the QCs should account for the endogenous concentrations in the authentic matrix and be representative of the expected study sample concentrations.
The QCs should resemble study samples and should be prepared in the same matrix. In principle, all QC concentrations used for validation should be aliquots of the authentic biological matrix unspiked (endogenous QC with a concentration between LLOQ and low QC, if possible) and spiked with known amounts of the authentic analyte (low QC, middle QC and high QC). In spiked samples (e.g., LLOQ, low QC), the added amount should be enough to provide concentrations that are three-fold higher or statistically different from the endogenous concentration. If opti,ons such as multiple lots, alternative vendors and matrices of special populations that might contain a lower concentration of the analyte continue to yield matrices in which the endogenous levels are so high that it is not possible to prepare the low QC in the authentic matrix, diluted (surrogate) matrix may be used.
7.1.2 Selectivity, Recovery and Matrix Effects for Methods for Analytes that are also E,ndogenous Molecules
The assessment of selectivity is complicated by the absence of interference-free matrix. For chromatography, peak purity should be investigated as part of method validation by analysing matrices obtained from several donors (at least six normal blanks, one haemolysed blank and one lipemic blank) using a discriminative detection system (e.g., tandem mass spectrometry (MS/MS)). Other approaches, if justified by scientific principles, may also be considered.
For the Standard Addition and Background Subtraction Approaches, as the same biological matrix and analyte are used for study samples and calibration standards, the same recovery and matrix effect occurs in the study samples and the calibration standards. However, if the endogenous component were not completely identical (e.g., recombinant proteins) the potential difference in recovery should be assessed in a parallelism test. For the Surrogate Matrix and Surrogate Analyte Approaches, the matrix effect and the extraction recovery may differ between calibration standards and study samples. Matrix effect should be evaluated to ensure that it does not impact accuracy and precision, mainly at LLOQ level.
• If the Surrogate Matrix Approach is used, the impact of the different matrix effect and recovery in both the surrogate and authentic matrix should be assessed. This should be investigated in an experiment using QCs spiked with analyte in the matrix, the endogenous matrix only and spiked analyte in the surrogate matrix alone against the surrogate calibration curve.
• If the Surrogate Analyte Approach is used in mass spectrometry chromatographic methods, the impact of the different matrix effect and recovery between surrogate and authentic endogenous analytes should be evaluated. This should be investigated in an experiment using QCs spiked with analyte in the matrix, the endogenous matrix only and spiked surrogate analyte in the matrix against the surrogate calibration curve.
• In certain cases, dilution of the QCs with surrogate matrix may be necessary (e.g., for background subtraction methods) where the endogenous level is high and the LLOQ needs to be reduced. In these cases, the recovery and matrix effect experiments should be repeated with authentic biological matrices with endogenous concentrations between LLOQ and low QC, if available.
Refer to Sections 3 and 4 for the acceptance criteria for chromatography and LBAs, respectively.
Since the composition of the biological matrix might affect method performance, it is necessary to investigate matrices from at least six (chromatographic methods)/ten (LBA) different donors, except in the Standard Addition Approach, where each sample is analysed with its own calibration curve.
7.1.3 Parallelism for Methods for Analytes that are also Endogenous Molecules
Parallelism assures that observed changes in response per given changes in analyte concentrations are equivalent for the surrogate and the authentic biological matrix across the range of the method. Parallelism should be evaluated in the Surrogate Matrix and Surrogate Analyte Approaches, taking into account that parallelism is assessed differently in LBA and chromatographic methods.
7.1.4 Accuracy and Precision for Methods for Analytes that are also Endogenous Molecules
Accuracy and precision should meet criteria specified in Sections 3 and 4 for chromatography and LBAs, respectively.
In case of using a surrogate matrix or analyte approaches, the assessment of accuracy and precision should be performed by analysing the QCs against the surrogate calibration curve.
The concentration of the endogenous molecule in the blank matrix may be determined and subtracted from the total concentrations observed in the spiked samples. Accuracy is recommended to be calculated using the following formula when QCs are spiked with the authentic analyte in the matrix containing endogenous levels of the analyte:
𝐴𝑐𝑐𝑢𝑟𝑎𝑐𝑦 (%) = 100 ×
(Measured concentration of spiked sample − endogenous concentration ) Spiked concentration
Only the precision can be determined from the analysis of each unspiked/endogenous QC.
7.1.5 Stability for Methods for Analytes that are also Endogenous Molecules
To mimic study samples as much as possible, stability experiments should be investigated with the authentic analyte in the authentic biological matrix and with unspiked/endogenous QCs (blank matrix with endogenous molecule) as well as spiked low QC and high QCs as defined in Section 7.1.1. However, if a surrogate matrix is used for calibration standards, stability should also be demonstrated for the analyte in the surrogate matrix, as this could differ from stability in the authentic biological matrix.
7.2 Parallelism
Parallelism is defined as a parallel relationship between the calibration curve and serially diluted study samples to detect any influence of dilution on analyte measurement. Although lack of parallelism is a rare occurrence for bioanalytical methods for PK evaluation, parallelism of LBA should be evaluated on a case-by-case basis, e.g., where interference caused by a matrix component (e.g., presence of endogenous binding protein) is suspected during study sample analysis. Parallelism investigations, or the justification for its absence, should be included in the Bioanalytical Report. Some methods may demonstrate parallelism for one patient population, but lack it for another population. Generally, these experiments should be conducted during the analysis of the study samples due to the unavailability of study samples during method development or validation. A study sample with a high concentration (preferably close to Cmax) should be diluted to at least three concentrations with blank matrix. The consistency of the back calculated concentrations between samples in a dilution series should not exceed 30% CV. However, when applying the 30% criterion, data should be carefully monitored as results that pass this criterion may still reveal trends of non-parallelism. In the case that the sample does not dilute linearly (i.e., in a non-parallel manner), a procedure for reporting a result should be defined a priori.
7.3 Recovery
For methods that employ sample extraction, the recovery (extraction efficiency) should be evaluated. Recovery is reported as a percentage of the known amount of an analyte carried through the sample extraction and processing steps of the method. Recovery is determined by comparing the analyte response in a biological sample that is spiked with the analyte and processed, with the response in a biological blank sample that is processed and then spiked with the analyte. Recovery of the analyte does not need to be 100%, but the extent of recovery of an analyte and of the IS (if used) should be consistent. Recovery experiments are recommended to be performed by comparing the analytical results for extracted samples at multiple concentrations, typically three concentrations (low, medium and high).
7.4 Minimum Required Dilution
MRD is a dilution factor employed in samples that are diluted with buffer solution to reduce the background signal or matrix interference on the analysis using LBA. The MRD should be identical for all samples including calibration standards and the QCs and it should be determined during method development. If MRD is changed after establishment of the method, partial validation is necessary. MRD should be defined in the Validation Report of the analytical method.
7.5 Commercial and Diagnostic Kits
Commercial or diagnostic kits (referred to as kits) are sometimes co-developed with new chemical or biological drugs for point-of-care patient diagnosis. The recommendations in this section of the guideline do not apply to the development of kits that are intended for point-of- care patient diagnosis (e.g., companion or complimentary diagnostic kits). Refer to the appropriate guideline documents regarding regulatory expectations for the development of these kits.
If an applicant repurposes a kit (instead of developing a new method) or utilises “research use only” kits to measure chemical or biological drug concentrations during the development of a novel drug, the applicant should assess the kit validation to ensure that it conforms to the drug development standards described in this guideline.
Validation considerations for kit assays include, but are not limited to, the following:
• If the reference standard in the kit differs from that of the study samples, testing should evaluate differences in assay performance of the kit reagents. The specificity, accuracy, precision and stability of the kit assay should be demonstrated under actual conditions of
use in the facility conducting the sample analysis. Modifications from kit processing instructions should be completely validated.
• Kits that use sparse calibration standards (e.g., one- or two-point calibration curves) should include in-house validation experiments to establish the calibration curve with a sufficient number of standards across the calibration range.
• Actual QC concentrations should be known. Concentrations of QCs expressed as ranges are not sufficient for quantitative applications. In such cases QCs with known concentrations should be prepared and used, independent of the kit-supplied QCs.
• Calibration standards and QCs should be prepared in the same matrix as the study samples. Kits with calibration standards and QCs prepared in a matrix different from the study samples should be justified and appropriate experiments should be performed.
• If multiple kit assay lots are used within a study, lot-to-lot variability and comparability should be addressed for any critical reagents included in the kits.
• If a kit using multiple assay plates is employed, sufficient replicate QCs should be used on each plate to monitor the accuracy of the assay. Acceptance criteria should be established for the individual plates and for the overall analytical run.
7.6 New or Alternative Technologies
When a new or alternative technology is used as the sole bioanalytical technology from the onset of drug development, cross validation with an existing technology is not required.
The use of two different bioanalytical technologies for the development of a drug may generate data for the same product that could be difficult to interpret. This outcome can occur when one platform generates drug concentrations that differ from those obtained with another platform. Therefore, when a new or alternative analytical platform is replacing a previous platform used in the development of a drug it is important that the potential differences are well understood. The data generated from the previous platform/technology should be cross validated to that of the new or alternative platform/technology. Seeking feedback from the regulatory authorities is encouraged early in drug development. The use of two methods or technologies within a comparative BA/BE study is strongly discouraged.
The use of new technology in regulated bioanalysis should be supported by acceptance criteria established a priori based on method development and verified in validation.
7.6.1 Dried Matrix Methods
Dried matrix methods (DMM) is a sampling methodology that offers benefits such as collection of reduced blood sample volumes as a microsampling technique for drug analysis and ease of collection, storage and transportation. In addition to the typical methodological validation for LC-MS or LBA, use of DMM necessitates further validation of this sampling approach before using DMM in studies that support a regulatory application, such as:
• Haematocrit (especially for spotting of whole blood into cards)
• Sample homogeneity (especially for sub-punch of the sample on the card/device)
• Extraction of the sample from the dried matrix
• DMM sample collection for ISR
o Care should be taken to ensure sufficient sample volumes or numbers of replicates are retained for ISR
o Should be assessed by multiple punches of the sample or samples should be taken in duplicate
When DMM is used for clinical or nonclinical studies in addition to typical liquid approaches (e.g., liquid plasma samples) in the same studies, these two methods should be cross validated as described (Refer to Section 6.2). For nonclinical TK studies, refer to Section 4.1 of ICH S3A Q&A. Feedback from the appropriate regulatory authorities is encouraged in early drug development.
8. DOCUMENTATION
General and specific SOPs and good record keeping are essential to a properly validated analytical method. The data generated for bioanalytical method validation should be documented and available for data audit and inspection. Table 1 describes the recommended documentation for submission to the regulatory authorities and documentation that should be available at the analytical site at times of inspection. This documentation may be stored at the analytical site or at another secure location. In this case the documentation should be readily available when requested.
All relevant documentation necessary for reconstructing the study as it was conducted and reported should be maintained in a secure environment. Relevant documentation includes, but is not limited to, source data, protocols and reports, records supporting procedural, operational, and environmental concerns and correspondence records between all involved parties.
Regardless of the documentation format (i.e., paper or electronic), records should be contemporaneous with the event and subsequent alterations should not obscure the original data. The basis for changing or reprocessing data should be documented with sufficient detail, and the original record should be maintained.
8.1 Summary Information
Summary information should include the following items in Section 2.6.4/2.7.1 of the Common Technical Document (CTD; or electronic CTD, eCTD)) or reports:
• A summary of methods used for each study should be included. Each summary should provide the method title, method identification code, the assay type, the Bioanalytical Report code, effective date of the method, and the associated Validation Report codes.
• A summary table of all the relevant Validation Reports should be provided for each analyte, including Partial Validation and Cross Validation Reports. The table should include the method identification code, the type of method, the reason for the new method or additional validation (e.g., to lower the limit of quantification). Changes made to the method should be clearly identified.
• A summary table cross-referencing multiple identification codes should be provided when a method has different codes for the method, the Validation Reports and the Bioanalytical Reports.
• Discussion of method changes (e.g., evolution of methods, reason(s) for revisions, unique aspects)
• For comparative BA/BE studies, a list of regulatory site inspections including dates and outcomes for each analytical site if conducted over the last three years, and one year post study completion.
8.2 Documentation for Validation and Bioanalytical Reports
Table 1 describes the recommended documentation for the Validation and Bioanalytical Reports.
Table 1: Documentation and Reporting
Items Documentation at the Analytical Site Validation Report* Bioanalytical Report*
Chromatographic System Suitability • Dates, times, and samples used for suitability testing • Not applicable • Not applicable
Synopsis
Overview of Method Evolution • History/evolution of methods (e.g., to explain revisions, unique aspects with supportive data, if available) • Not applicable • Not applicable
Reference Standards • CoA or equivalent alternative to ensure quality (including purity), stability/expiration/retest date(s), batch number, and manufacturer or source
• Records of receipt, use, and storage conditions.
• If expired, recertified CoA, or
retest of quality and identity with retest dates • A copy of the CoA or equivalent alternative including batch/lot number, source, quality (including purity), storage conditions, and expiration/retest date, or table with this information.
• If expired, quality and stability at the time of use and retest dates and retested values. • A copy of the CoA or equivalent alternative including batch /lot number, source, quality (including purity), storage conditions, and expiration/retest date or a table with this information.
• If expired, quality and stability at the time of use and retest dates and retested values.
Internal Standard • IS quality or demonstration of suitability
• Records of receipt, use, and storage conditions • Name of reagent or standard
• Origin • Name of reagent or standard
• Origin
Items Documentation at the Analytical Site Validation Report* Bioanalytical Report*
Critical Reagents • Name of reagent
• Batch/Lot number
• Source/Origin
• Concentration, if applicable
• Retest date (expiry date)
• Storage conditions • Name of reagent
• Batch/Lot number
• Source/Origin
• Concentration, if applicable
• Retest date (expiry date)
• Storage conditions • Name of reagent
• Batch/Lot number
• Source/Origin
• Concentration, if applicable
• Retest date (expiry date)
• Storage conditions
Stock/Working Solutions • Record of preparation, and use of stock/working solutions
• Storage location and condition • Notation that solutions were used within stability period
• Stock/working solution stability
• Storage conditions • Notation that solutions were used within stability period
• Stock/working solution stability †
• Storage conditions†
Blank Matrix • Records of matrix descriptions, lot numbers, receipt dates, storage conditions, and source/supplier • Description, lot number, receipt dates • Description, lot number, receipt dates††
Calibration Standards and QCs • Records and date of preparation
• Record of storage temperature (e.g., log of in/out dates, analyst, temperatures, and freezer(s)) • Description of preparation including matrix
• Batch number, preparation dates and stability period
• Storage conditions (temperatures, dates, duration, etc.) • Description of preparation†
• Preparation dates and stability period
• Storage conditions†
Items Documentation at the Analytical Site Validation Report* Bioanalytical Report*
Standard Operating Procedures (SOPs; Procedures) Procedures for all aspects of analysis, such as:
• Method/procedure (validation/analytical)
• Acceptance criteria (e.g., run, calibration curve, QCs)
• Instrumentation
• Reanalysis
• ISR
• Record of changes to SOP (change, date, reason, etc.) • A detailed description of the method procedures • A list of procedures/analytical protocols used for the method
Sample Tracking • Study sample receipt, and condition on receipt
• Records that indicate how samples were transported and received. Sample inventory and reasons for missing samples
• Location of storage (e.g., freezer unit)
• Tracking logs of QCs, calibration standards, and study samples
• Freezer logs for QCs, calibration standards, and study samples entry and exit • Not applicable For All Studies
• Dates of receipt of shipments number of samples
• Sample condition on receipt
• Analytical site storage condition and location
• Storage: total duration from sample collection to analysis
• List of any deviations from planned storage conditions, and potential impact
Additionally, for Comparative BA/BE
Studies also include:
• The subject ID
Items Documentation at the Analytical Site Validation Report* Bioanalytical Report*
Analysis • Documentation and data for system suitability checks for chromatography
• Instrument use log, including dates of analysis for each run
• Sample extraction logs including documentation of processing of calibration standards, QCs, and study samples for each run, including dates of extraction
• Identity of QCs and calibration standard lots, and study samples in each run
• Documentation of instrument settings and maintenance
• Laboratory information management system (LIMS)
• Validation information, including documentation and data for:
o Selectivity, specificity, sensitivity, precision and accuracy, carry-over, dilution, recovery, matrix effect
o Bench-top, freeze-thaw, long- term, extract, and stock solution stability
o Cross/partial validations, if applicable For All Studies:
• Table of all runs (including failed runs), and analysis dates
• Table of calibration standard concentration and response functions results (calibration curve parameters) of all accepted runs with accuracy and precision.
• Table of within- and between- run QC results and calibration standards (from accuracy and precision runs). Values outside the acceptance criteria should be clearly marked.
• Include total error for LBA methods
• Data on selectivity, specificity, dilution linearity and sensitivity (LLOQ), carry- over, recovery. Bench-top, freeze-thaw, long-term, extract, and stock solution stability
• Partial/cross-validation, if applicable
• Append separate report for additional validation, if any
Additionally, for Comparative BA/BE
Studies also include:
• Instrument ID for each run in comparative BA/BE studies †
• 100% of run summary table of accepted and failed runs For All Studies:
• Table of all runs, status (accepted and failed), reason for failure, and analysis dates.
• Table of calibration standard concentration and response function results (calibration curve parameters) of all accepted runs with accuracy and precision.
• Table of QCs results of all accepted runs with overall (between-run) accuracy and precision results of the QCs and between-run accuracy and precision results from accepted runs.
• Table of reinjected runs with results from reinjected runs and reason(s) for reinjection
• QCs graphs trend analysis encouraged
• Study concentration results table.
Additionally, for Comparative BA/BE
Studies also include:
• Instrument ID for each run in comparative BA/BE studies†
• IS response plots for each analytical run, including failed runs
• 100% of run summary table of accepted and failed runs
Items Documentation at the Analytical Site Validation Report* Bioanalytical Report*
Chromatograms and Reintegration • Electronic audit trail:
• 100% e-chromatograms of original and reintegration from accepted and fail runs
• Reason for reintegration
• Mode of reintegration 100% of run summary tables of accepted and failed runs, including calibration curve, regression, weighting function, analyte and IS response and retention time, response ratio, integration type For All Studies:
• Representative chromatograms (original and reintegration)
• Reason for reintegration
• Chromatograms may be submitted as a supplement
Additionally, for Comparative
BA/BE Studies also include
• 100% chromatograms of original and reintegration from accepted and fail runs.
• 100% of run summary table of accepted and failed runs For All Studies:
• Chromatograms may be submitted as a supplement
• For studies other than comparative BA/BE, randomly selected chromatograms from 5% of samples submitted in application dossiers
• Reason for reintegration
• Identification and discussion of chromatograms with manual reintegration
• SOP for reintegration, as applicable
Additionally, for Comparative BA/BE
Studies also include
• 100% of chromatograms.
• Original and reintegrated chromatograms and initial and repeat integration results
• 100% of run summary table of accepted and failed runs
Table 1 continued: Documentation and Reporting
Items Documentation at the Analytical Site Validation Report* Bioanalytical Report*
Deviations from Procedures • Contemporaneous documentation of deviations/unexpected events
• Investigation of unexpected events
• Impact assessment • Description of Deviations
• Impact on study results
• Description and supporting data of significant
investigations • Description of deviations
• Impact on study results
• Description and supporting data of significant investigations
Reanalysis/Repeat Analysis • Procedures for conducting reanalysis/repeat analysis (define reasons for reanalysis, etc.)
• Retain 100% of repeat/reanalysed data
• Contemporaneous records of reason for repeats • Not applicable For All Studies:
• Table of sample IDs, reason for repeat analysis, original and repeat analysis values, reason for reported values, run IDs
Additionally, for Comparative
BA/BE Studies also include
• For comparative BA/BE studies, values from rejected runs should be included in a separate table.
ISR • Procedure for ISR
• ISR data: Run IDs, run summary sheets, chromatograms or other electronic instrument data files
• Document ISR failure investigations, if any • Not applicable • ISR data table (original and reanalysis values and run IDs, percent difference, percent passed)
• ISR failure investigations, if any††
Table 1 continued: Documentation and Reporting
Items Documentation at the Analytical Site Validation Report* Bioanalytical Report*
Communication • Between involved parties (Applicant, contract research organizations, and consultants) related to study/method • Not applicable • Not applicable
Audits and Inspections • Evidence of audit and inspections • Not applicable/Refer to Section 8.1 for summary information to include in
the eCTD • Not applicable/Refer to Section 8.1 for summary information to include in the
eCTD
*The applicant is expected to maintain data at the analytical site to support summary data submitted in Validation and Bioanalytical Reports. Validation and Bioanalytical Reports should be submitted in the application.
† May append or link from Validation Report.
††Submit either in Validation Report or in Bioanalytical Report
9. GLOSSARY Accuracy:
The degree of closeness of the measured value to the nominal or known true value under prescribed conditions (or as measured by a particular method). In this document accuracy is expressed as percent of the nominal value.
Accuracy (%) = (Measured Value/Nominal Value) × 100
Analysis:
A series of analytical procedures from sample processing/dilution to measurement on an analytical instrument.
Analyte:
A specific chemical moiety being measured, including an intact drug, a biomolecule or its derivative or a metabolite in a biological matrix.
Analytical Run (also referred to as “Run”):
A complete set of analytical and study samples with appropriate number of calibration standards and QCs for their validation. Several runs may be completed in one day or one run may take several days to complete.
Anchor Calibration Standards/Anchor Points:
Spiked samples set at concentrations below the LLOQ or above the ULOQ of the calibration curve and analysed to improve curve fitting in LBAs.
Batch (for Bioanalysis):
A batch is comprised of QCs and study samples, and possibly blanks, zero samples and calibration standards, which are handled during a fixed period of time and by the same group of analysts with the same reagents under homogenous conditions.
Batch (for Reference Standards and Reagents):
A specific quantity of material produced in a process or series of processes so that it is expected to be homogeneous within specified limits. Also referred to as “Lot”.
Bias:
The tendency of a measurement process to over- or under-estimate the value of a population parameter.
Bioanalytical Method:
Analytical method used in the quantitative determination of analytes in biological matrices.
Biological Drugs:
Drugs that are made by living organisms or cells (e.g., therapeutic proteins).
Biological Matrix:
A biological material including, but not limited to, blood, serum, plasma and urine.
Binding Reagent:
A reagent that binds to the analyte in LBA-based bioanalytical methods.
Blank Sample:
A sample of a biological matrix to which no analyte, no IS and no additional-alternative matrix or buffer has been added.
Calibration Curve:
The relationship between the instrument response (e.g., peak area, height or signal) and the concentration (amount) of analyte in the calibration standards within a given range. Also referred to as Standard Curve.
Calibration Range:
The interval between the upper and lower concentration (amounts) of analyte in the calibration standards (including these concentrations)
Calibration Standard:
A matrix to which a known amount of analyte has been added or spiked. Calibration standards are used to construct calibration curves.
Carry-over:
The appearance of an analyte signal in a sample from a preceding sample.
Chemical Drugs:
Chemically synthesised drugs.
Critical Reagent:
Critical reagents for LBAs include binding reagents (e.g., antibodies, binding proteins, peptides) and those containing enzymatic moieties that have a direct impact on the results of the assay.
Cross Validation:
Assessment of potential bias between two bioanalytical methods or the same bioanalytical method used in different laboratories in order to determine whether reported data are comparable.
Dilution Integrity:
Assessment of the sample dilution procedure to confirm that the procedure does not impact the measured concentration of the analyte.
Dilution Linearity:
A parameter demonstrating that the method can appropriately analyse samples at a concentration exceeding the ULOQ of the calibration curve without influence of prozone (hook) effect and that the measured concentrations are not affected by dilution within the calibration range in LBAs.
Dilution Factor:
The magnitude by which a sample is diluted.
Full Validation:
Establishment of all validation parameters that ensure the integrity of the method when applied to sample analysis.
Hook Effect:
Suppression of response due to very high concentrations of a particular analyte. A hook effect may occur in LBAs that use a liquid-phase reaction step for incubating the binding reagents with the analyte. Also referred to as prozone effect.
Incurred Sample:
A sample obtained from study subjects or animals.
Incurred Sample Reanalysis (ISR):
Reanalysis of a portion of the incurred samples in a separate analytical run on a different day to determine whether the original analytical results are reproducible.
Interfering Substance:
A substance that is present in the matrix that may affect the quantification of an analyte.
Internal Standard (IS):
A structurally similar analogue or stable isotope labelled compound added to calibration standards, QCs and study samples at a known and constant concentration to facilitate quantification of the target analyte.
Ligand Binding Assay (LBA):
A method to analyse an analyte of interest using reagents that specifically bind to the analyte. The analyte is detected using reagents labelled with e.g., an enzyme, radioisotope, fluorophore or chromophore. Reactions are carried out in microtitre plates, test tubes, disks, etc.
Lower Limit of Quantification (LLOQ):
The lowest amount of an analyte in a sample that can be quantitatively determined using a method with predefined precision and accuracy.
Matrix Effect:
The direct or indirect alteration or interference in response due to the presence of unintended analytes or other interfering substances in the sample.
Minimum Required Dilution (MRD):
The initial dilution factor by which biological samples are diluted with buffer solution for the analysis by LBAs. The MRD may not necessarily be the ultimate dilution but should be identical for all samples including calibration standards and QCs. However, samples may require further dilution.
Nominal Concentration:
Theoretical or expected concentration.
Parallelism:
Parallelism demonstrates that the serially diluted incurred sample response curve is parallel to the calibration curve. Parallelism is a performance characteristic that can detect potential matrix effects.
Partial Validation:
Validation based on evaluation of selected validation parameters. Applicable to methods that were changed after full validation.
Precision:
The closeness of agreement (i.e., degree of scatter) among a series of measurements. Precision is expressed as the coefficient of variation (CV) or the relative standard deviation (RSD) expressed as a percentage.
%CV = (Standard Deviation/Mean) x 100
Processed Sample:
The final sample that has been subjected to various manipulations (e.g., extraction, dilution, concentration).
Quality Control Sample (QC):
A biological matrix spiked with a known quantity of analyte that is used to monitor the performance of a bioanalytical method and assess the integrity and validity of the results of the unknown samples analysed in an individual batch or run.
Reanalysis:
An additional evaluation of a previously assayed sample. Also referred to as Repeat Analysis.
Recovery:
The extraction efficiency of an analytical process, reported as a percentage of the known amount of an analyte carried through the sample extraction and processing steps of the method.
Reference Standard:
A well-characterised substance of known purity and identity used to prepare calibration and quality control samples.
Reintegration:
Change of the original integration of a chromatographic peak
Replicate:
One of several determinations or measurements of a sample, calibration standards or QC.
Reproducibility:
The extent to which consistent results are obtained when an experiment is repeated.
Response Function:
A mathematical expression which adequately describes the relationship between instrument response (e.g., peak area or height ratio or signal) and the concentration (amount) of analyte in
the calibration standards. Response function is defined within a given range. See also Calibration Curve.
Run Summary Table:
Tabular output of all data from individual samples, QCs and calibration standards within the analytical run (e.g., for chromatography retention times, analyte and IS responses, concentrations, and dilution factors if any; for ligand binding assays analyte responses concentrations, dilution factors).
Selectivity:
Ability of an analytical method to differentiate and measure the analyte in the presence of interfering substances in the biological matrix (non-specific interference).
Sensitivity:
The lowest analyte concentration that can be measured with acceptable accuracy and precision (i.e., LLOQ).
Specificity:
Ability of an analytical method to detect and differentiate the analyte from other substances, including its related substances (e.g., substances that are structurally similar to the analyte, metabolites, isomers, impurities or concomitant medications).
Stability:
Measure of the intactness of an analyte (lack of degradation) in a given matrix under specific storage and use conditions relative to the starting material for given time intervals.
Standard Curve:
The relationship between the instrument response (e.g., peak area, height or signal) and the concentration (amount) of analyte in the calibration standards within a given range. Also referred to as calibration Curve.
Standard Operating Procedure (SOP):
Detailed written instructions to achieve uniformity of the performance of a specific function and/or process(es).
Stock Solution:
An analyte in a solvent or mixture of solvents at a known concentration, which is used to prepare calibration standards or QCs.
Study samples:
Samples from animals or subjects enrolled in nonclinical or clinical studies.
Surrogate Matrix:
An alternative to a study matrix of limited availability (e.g., tissue, cerebrospinal fluid, bile) or where the study matrix contains an interfering endogenous counterpart.
System Suitability:
Determination of instrument performance (e.g., signal-to-noise ratio, peak shape, retention time) by analysis of a prepared, spiked sample conducted prior to the analytical run and is not a part of the sample analysis.
Total Error:
The sum of the absolute value of the errors in accuracy (%) and precision (%). Total error is reported as percent (%) error.
Upper Limit of Quantification (ULOQ):
The highest amount of an analyte in a sample that can be quantitatively determined with pre- defined precision and accuracy.
Validation:
Demonstration that a bioanalytical method is suitable for its intended purpose.
Working Solution:
A non-matrix solution prepared by diluting the stock solution in an appropriate solvent. It is mainly added to matrix to prepare calibration standards and QCs.
Zero Sample:
A blank sample spiked with an IS.